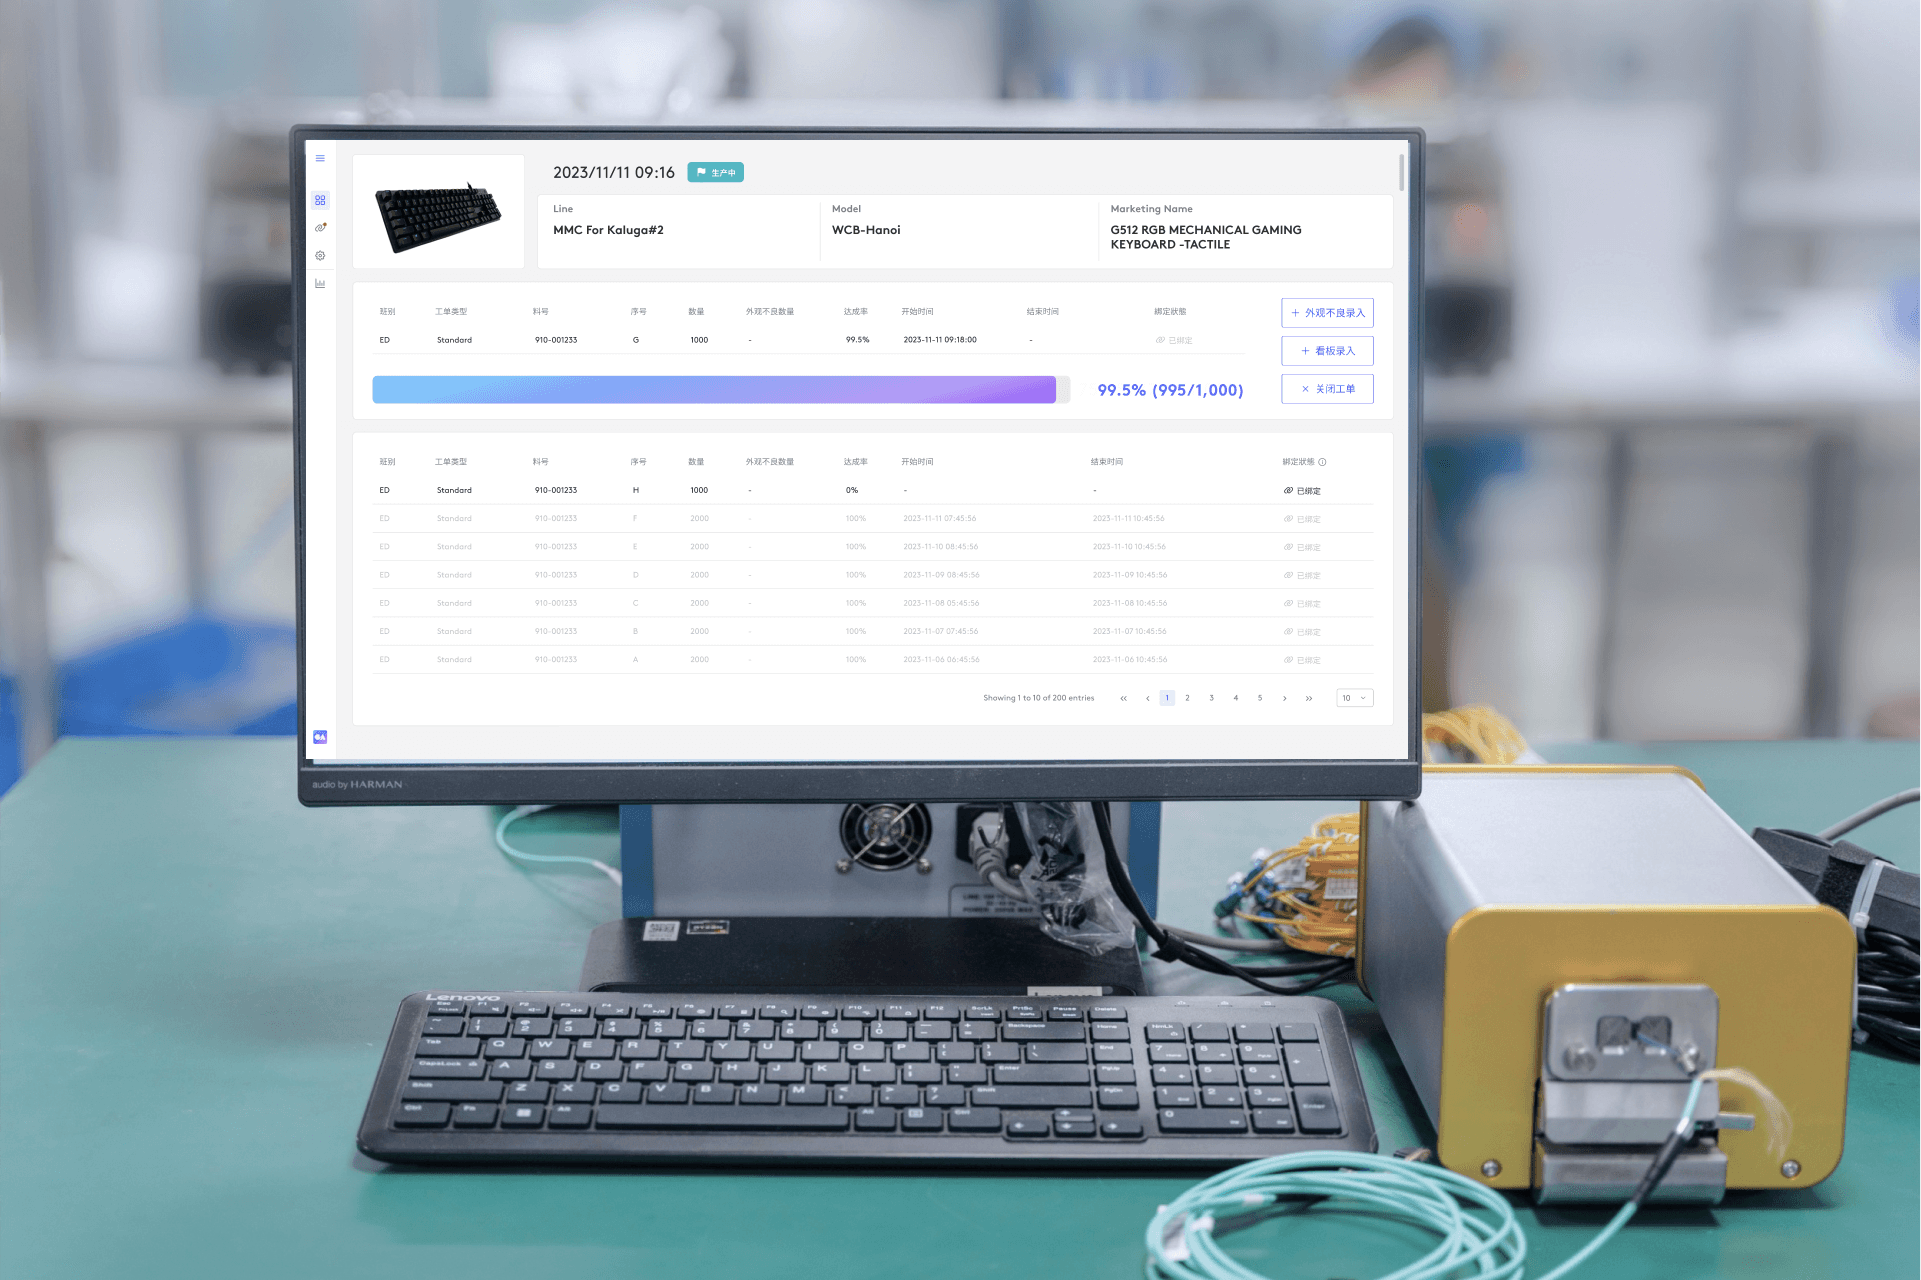
Starlight Factory System

Starlight Factory System
It covers three applications: Dashboard, Line App, and Data Maintenance, and assists technicians and managers in improving working efficiency and reducing error operations.
It covers three applications: Dashboard, Line App, and Data Maintenance, and assists technicians and managers in improving working efficiency and reducing error operations.
Role
UIUX Designer
Defined the user flow and designed the user interface for 3 applications on the manufacturing factory system
Duration
4 Months
4 Months
September 2023 - December 2023
Overview
Goals
The design of software applications for automated production lines is flawed, requiring technicians to operate manually. As a result, it becomes essential to develop a comprehensive software and hardware integration system that can facilitate the uploading of production station data to the database. Such a system would provide technicians with a clearer understanding of the production status and enable them to manage production line operations easily.
The design of software applications for automated production lines is flawed, requiring technicians to operate manually. As a result, it becomes essential to develop a comprehensive software and hardware integration system that can facilitate the uploading of production station data to the database. Such a system would provide technicians with a clearer understanding of the production status and enable them to manage production line operations easily.
Challenge
Factory operators must always monitor the automatic production machine to confirm the production status and manually enter defective product numbers, resulting in time-consuming production and possible manual errors. In addition, a unified central management system is lacking, and users must set production parameters for each machine. Finally, there was no dashboard with real-time production reporting to review production status.
Factory operators must always monitor the automatic production machine to confirm the production status and manually enter defective product numbers, resulting in time-consuming production and possible manual errors. In addition, a unified central management system is lacking, and users must set production parameters for each machine. Finally, there was no dashboard with real-time production reporting to review production status.
Outcome
The system operates successfully and processes hundreds of production lines per working day. Our work reduced the error results from manual inputs, sped up the production, and fulfilled the customized access of stakeholders from factory managers to technicians and suppliers.
The system operates successfully and processes hundreds of production lines per working day. Our work reduced the error results from manual inputs, sped up the production, and fulfilled the customized access of stakeholders from factory managers to technicians and suppliers.
User Story
As a technician, I would like to operate the machine without a complex learning process.
As a technician, I would like to have a more intuitive display so that I can quickly find out the production issue and fix it.
As a manufacturing manager, I would like to handle the criteria of all factories and all stations in one place, so that I can schedule the production plan.
How We Rebuilt the System Structure?


In response to the inefficiency of the previous system in receiving event data from production machines, we implemented a two-way sync solution. The Aurora Database, also called the Data Maintenance system, enables managers to control criteria for all stations while simultaneously receiving data from all production stations through the line App systems installed on them.
By implementing this system, managers can uniformly set standards and discover customized settings from production stations. Additionally, technicians on each production station can now monitor the status from the Dashboard and resolve errors in real-time rather than waiting for them to transfer to the database. This new system represents a significant improvement in data management and production efficiency.
Prototyping Iterations
Lo-fi Dashboard
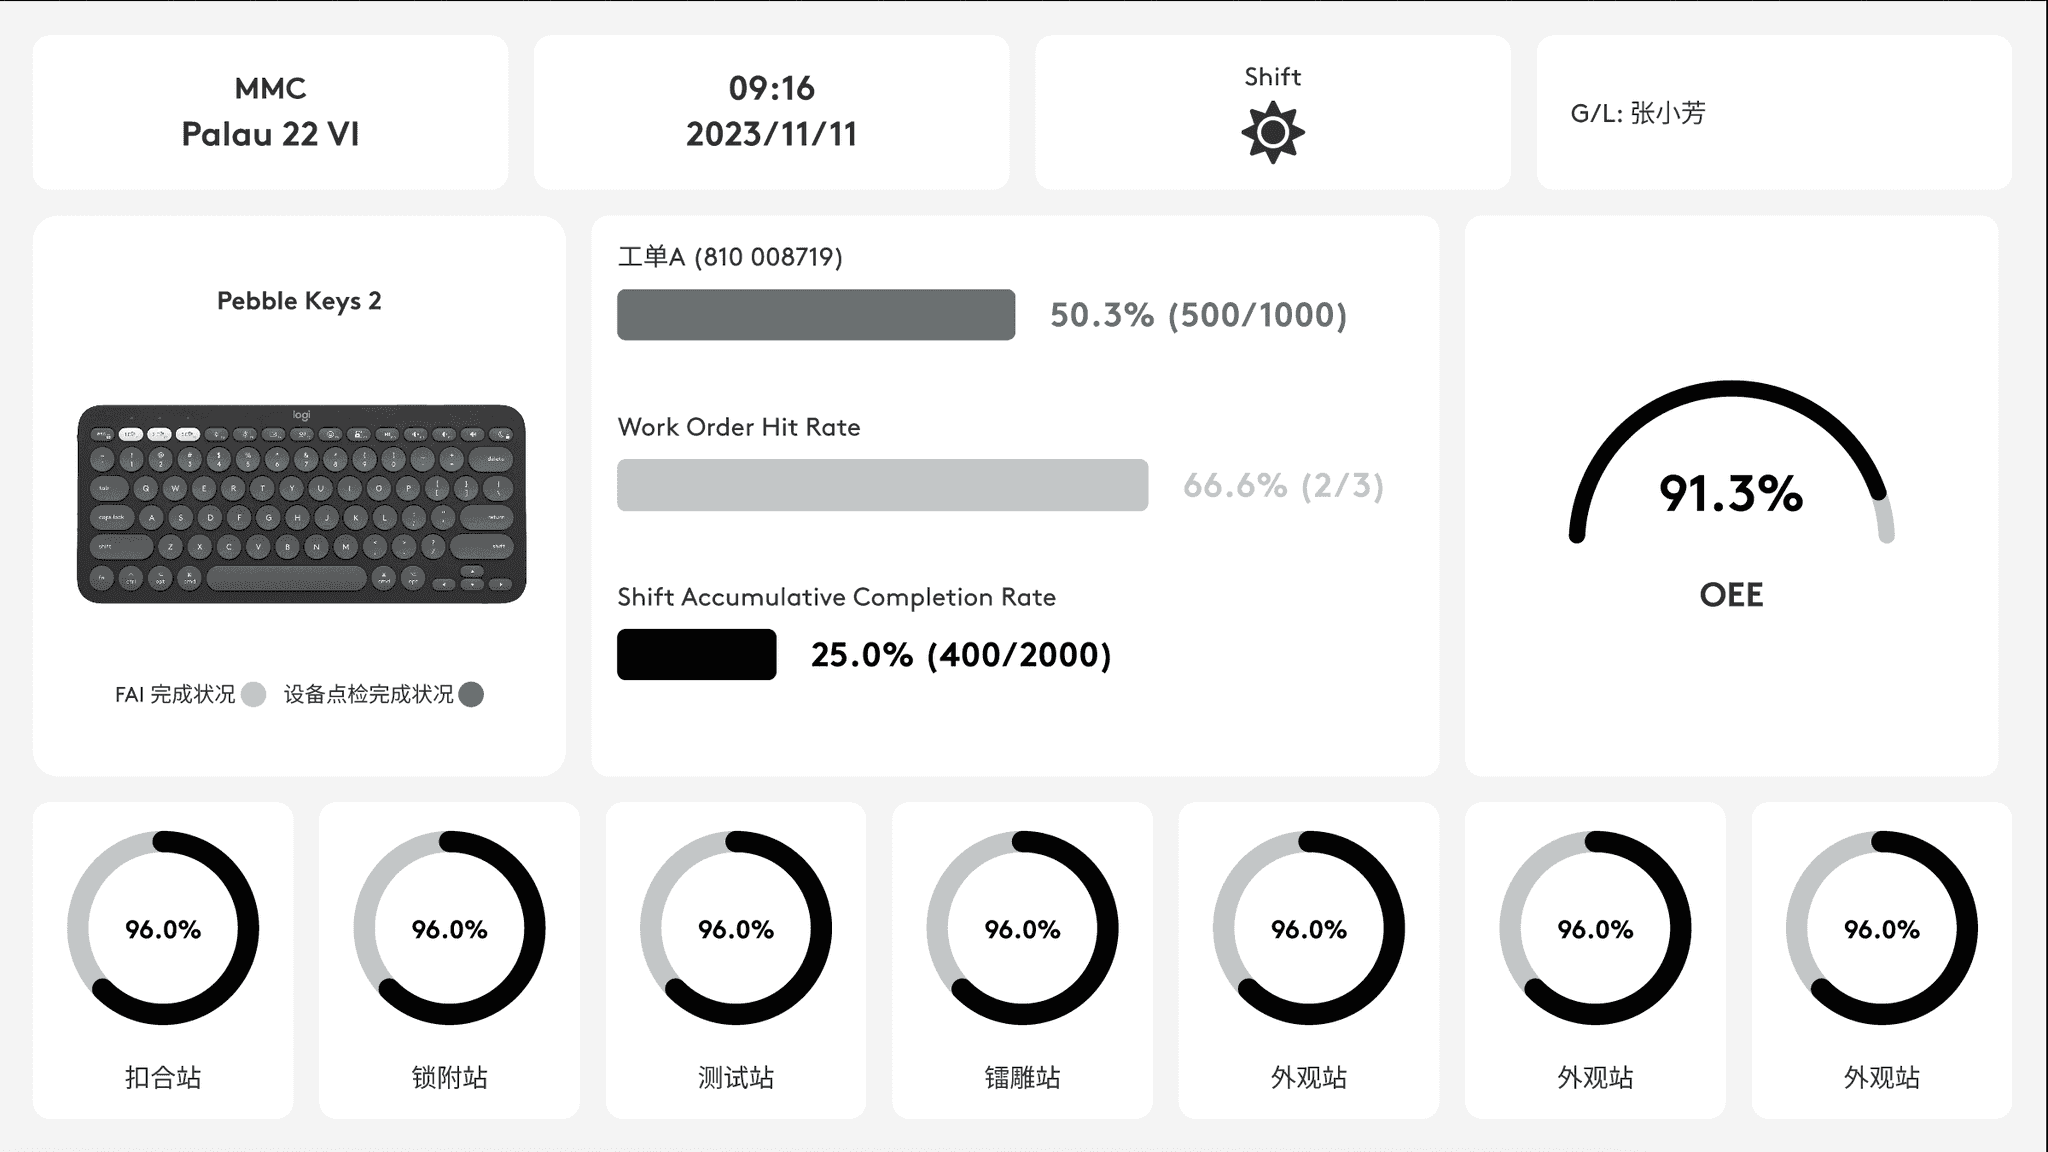

The Lo-fi version of the dashboard displays all the information required for the manufacturing team. However, the visualization is not arranged in the best way. The less essential data comprised nearly 1/3 of the spaces, such as current time, shift, and group leader. Also, the design did not consider the extreme situation when production stations increased.
The Lo-fi version of the dashboard displays all the information required for the manufacturing team. However, the visualization is not arranged in the best way. The less essential data comprised nearly 1/3 of the spaces, such as current time, shift, and group leader. Also, the design did not consider the extreme situation when production stations increased.
Enhanced Dashboard
Enhanced Dashboard
Enhanced Dashboard
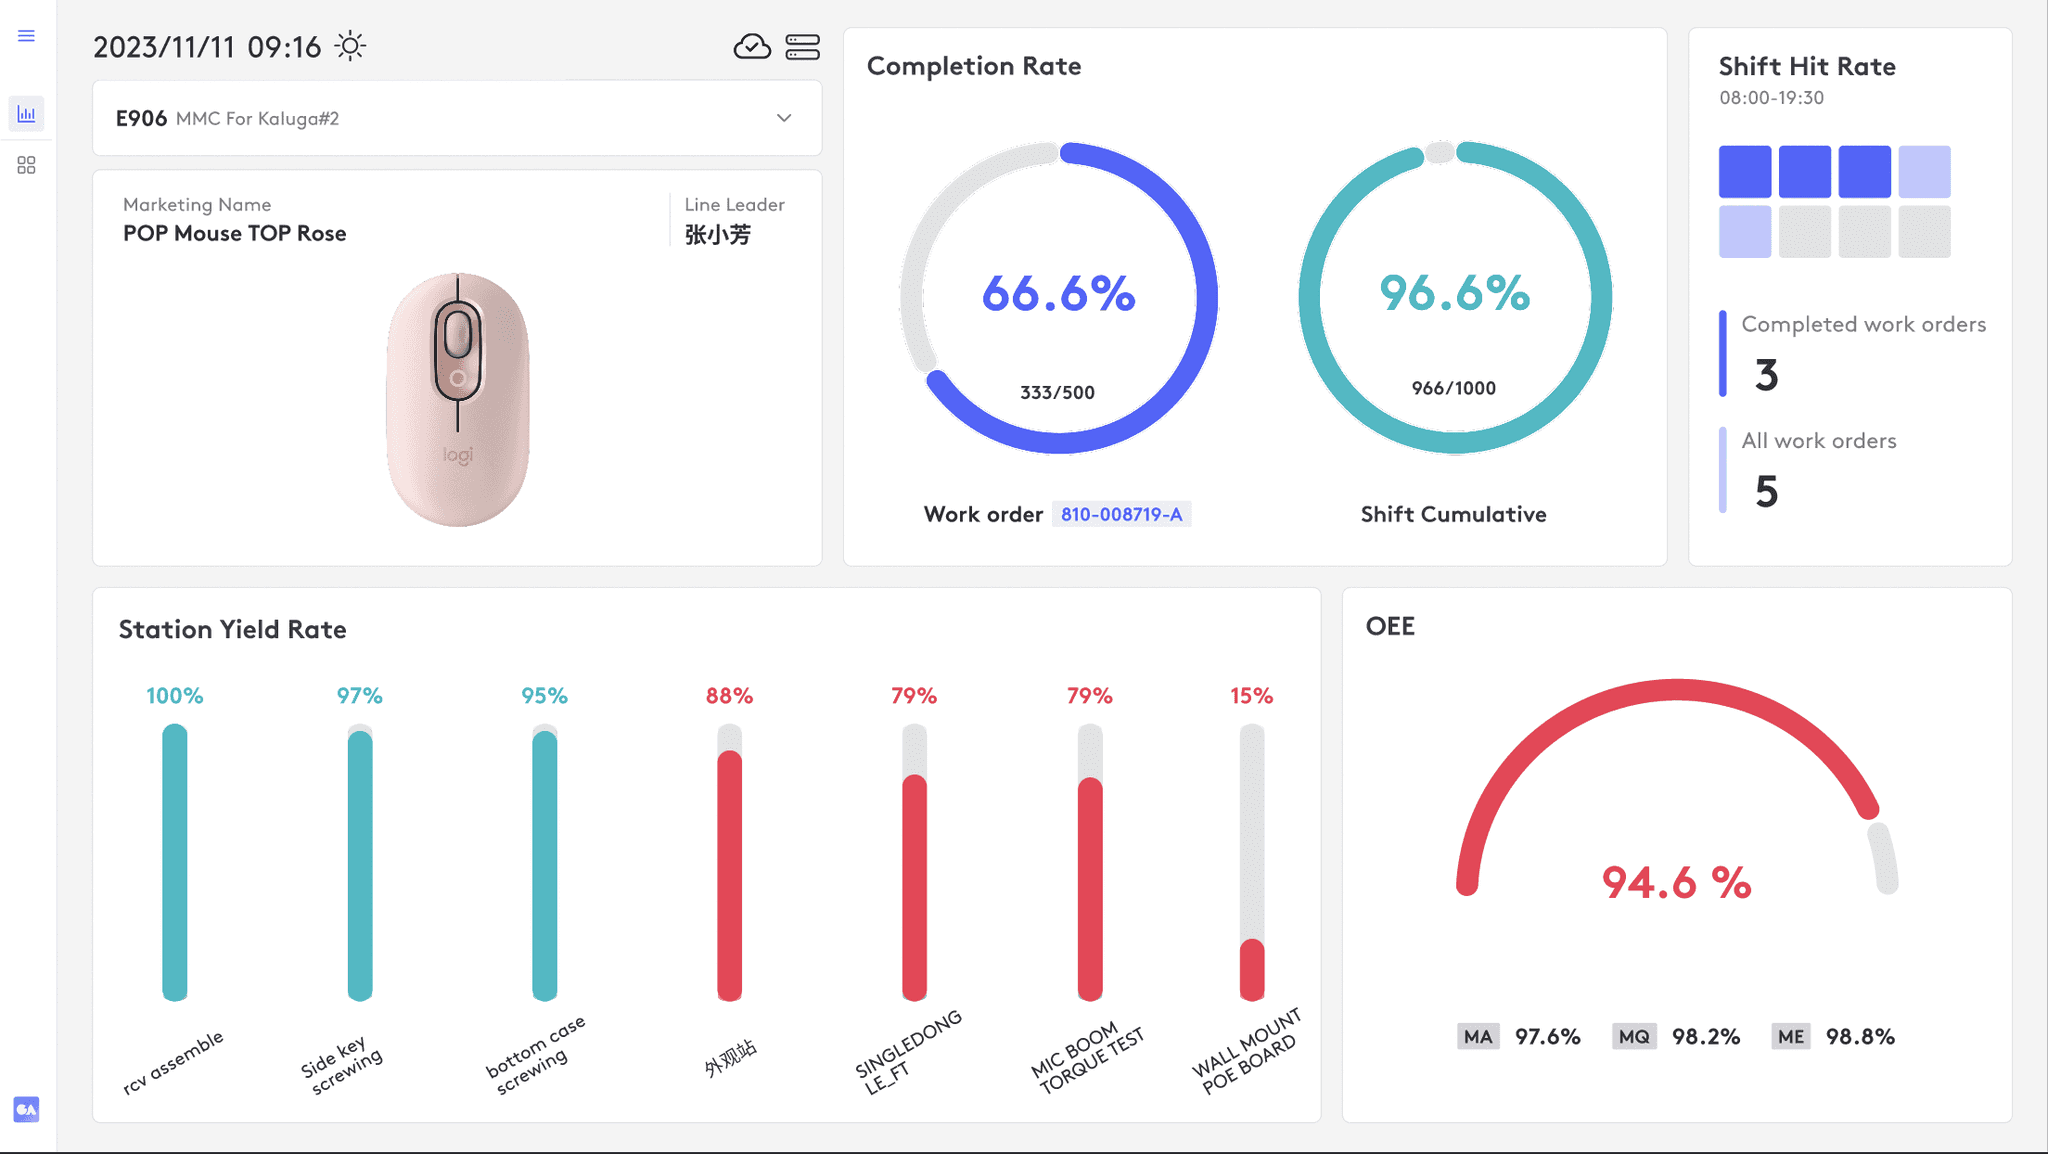

First, the new design shrank the less pivotal information at the top left corner, where users first navigated to check the product line.
Moreover, I emphasized the Completion Rate and Yield Rate by highlighting the charts' color and leaving more spaces to display.
To avoid dulling the visualization, I considered four types of charts to help users locate the data more efficiently.
Last, I designed the Station Yield Rate bar chart as horizontal scrolling regarding the increasing station quantity.
Lo-fi Line App
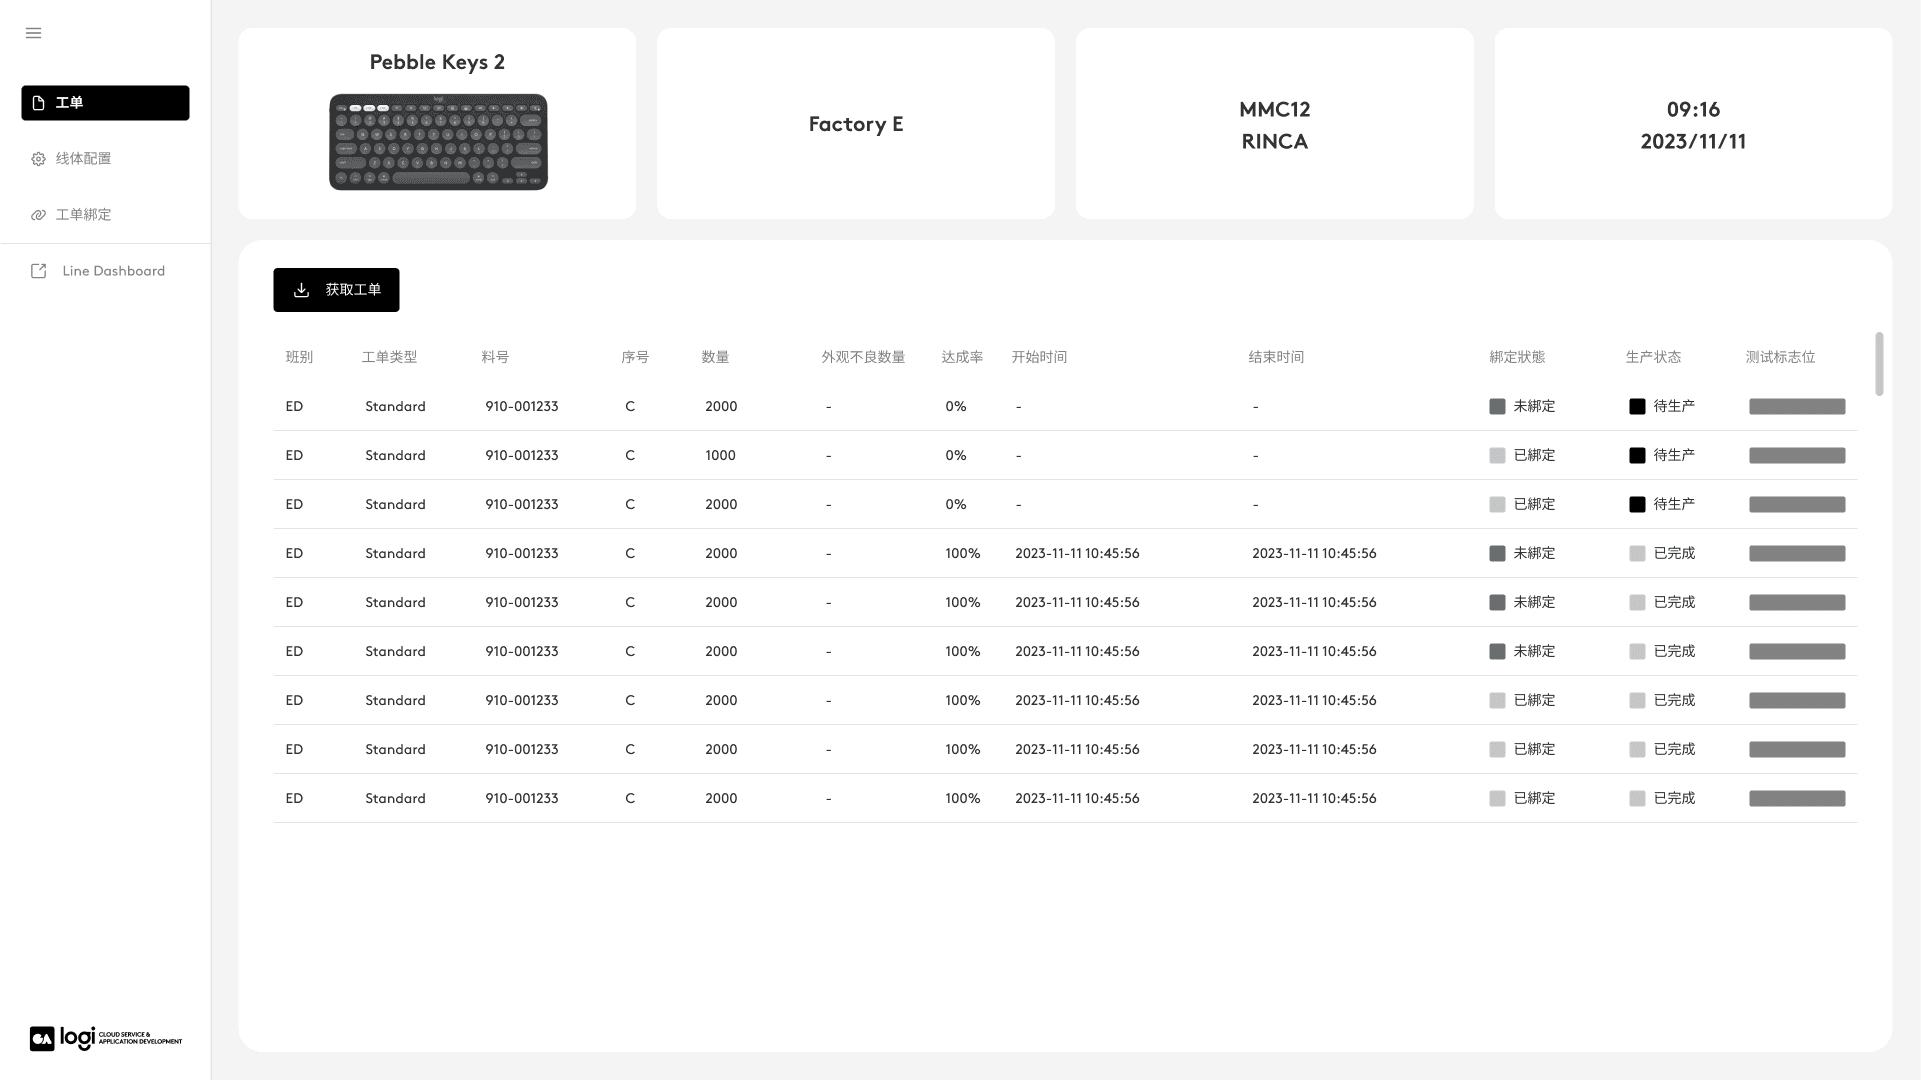

Technicians operate the Line App to kick off/ stop production. Once a work order is in production, other work orders are disabled. However, this design could be enhanced due to a lack of consideration of emphasizing the in-production work order and it would take users more time to determine the operations.
Technicians operate the Line App to kick off/ stop production. Once a work order is in production, other work orders are disabled. However, this design could be enhanced due to a lack of consideration of emphasizing the in-production work order and it would take users more time to determine the operations.
Enhanced Line App
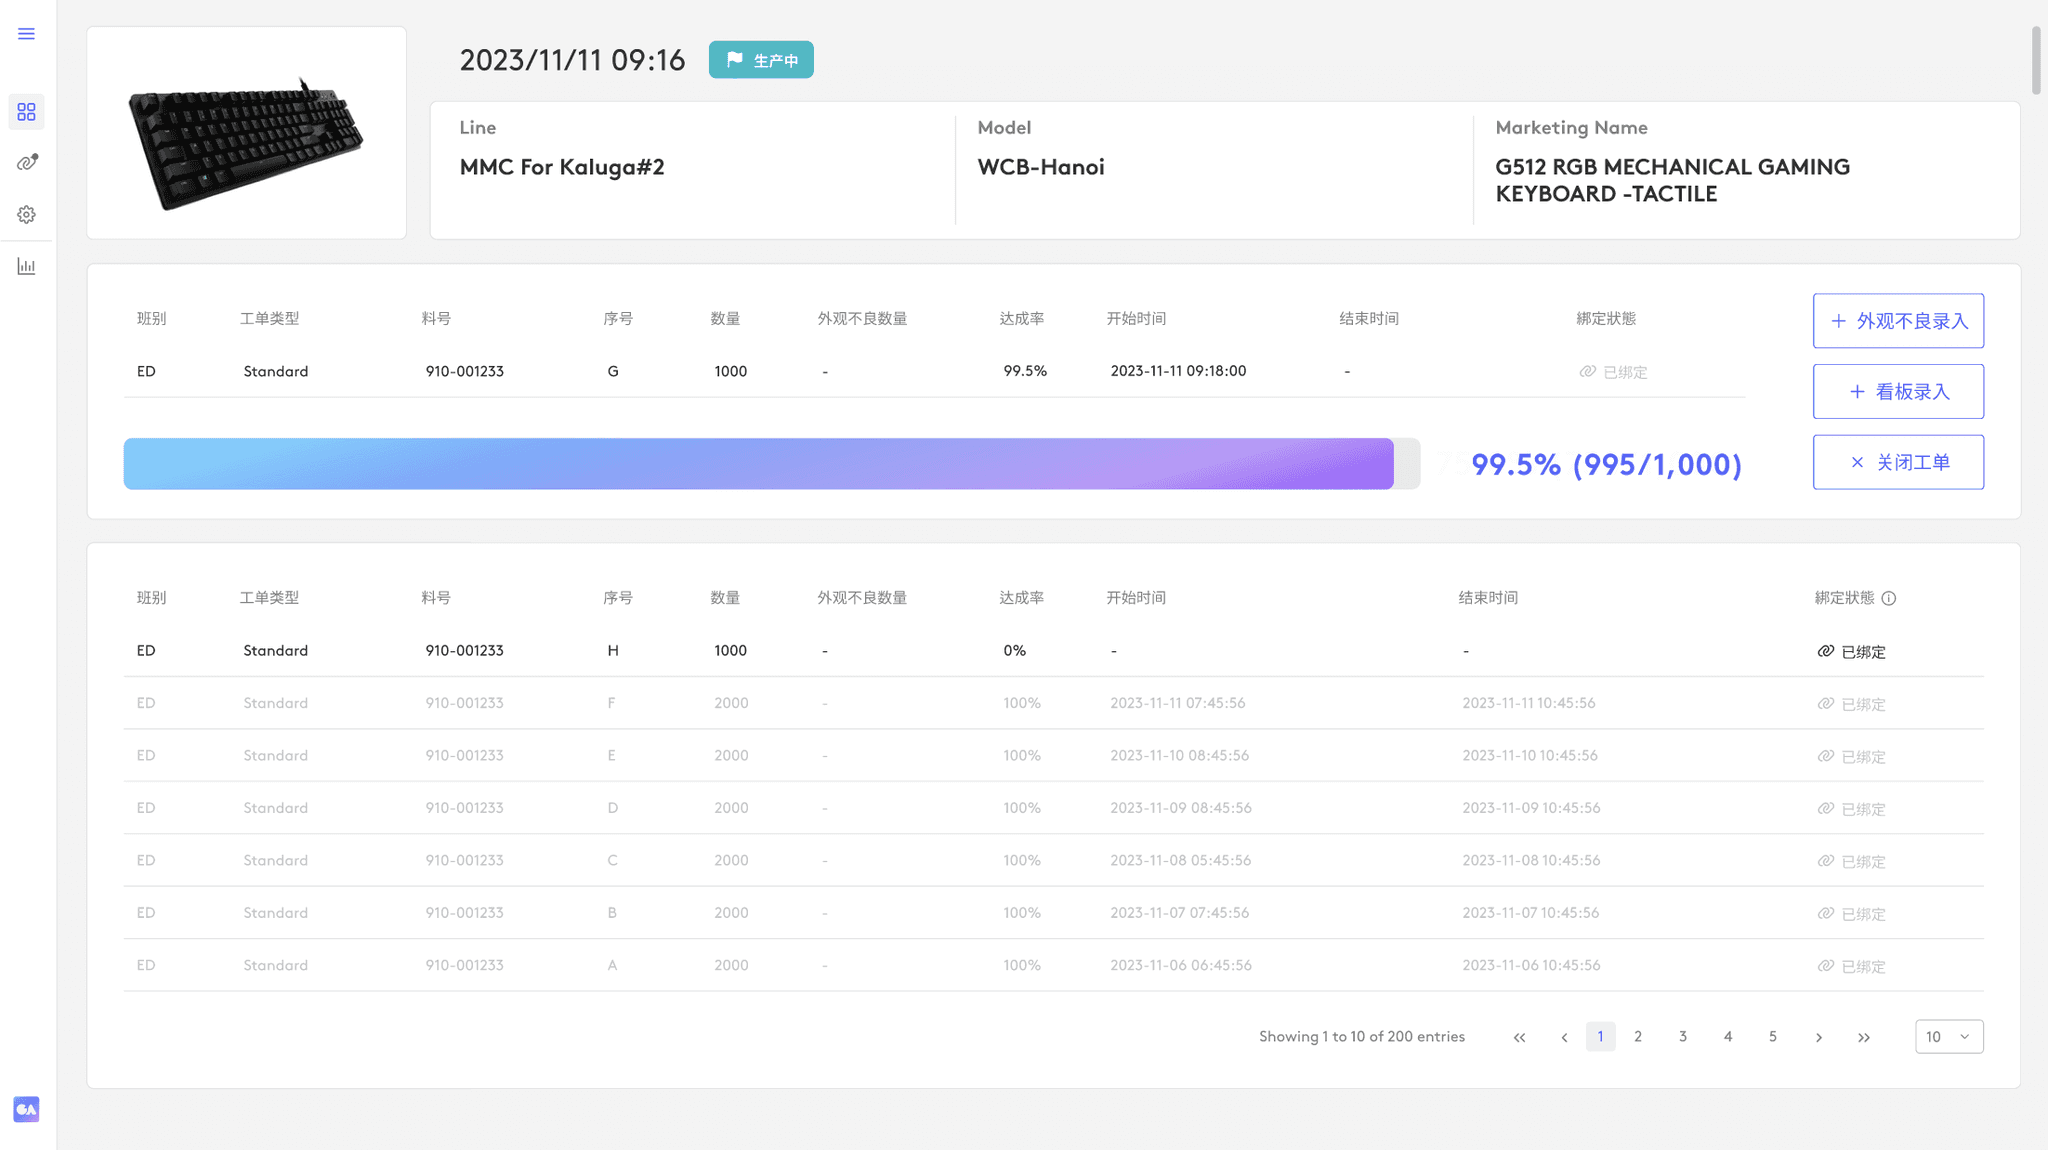

I designed an independent card for the in-production work order. With highlight color and instant data, technicians can distinguish at a glimpse. Besides, during production, technicians need to input defects or close the order; I put the call-to-action buttons on the bar's right, enabling them to navigate to them directly.
I designed an independent card for the in-production work order. With highlight color and instant data, technicians can distinguish at a glimpse. Besides, during production, technicians need to input defects or close the order; I put the call-to-action buttons on the bar's right, enabling them to navigate to them directly.
Lo-fi Scheduled Downtime
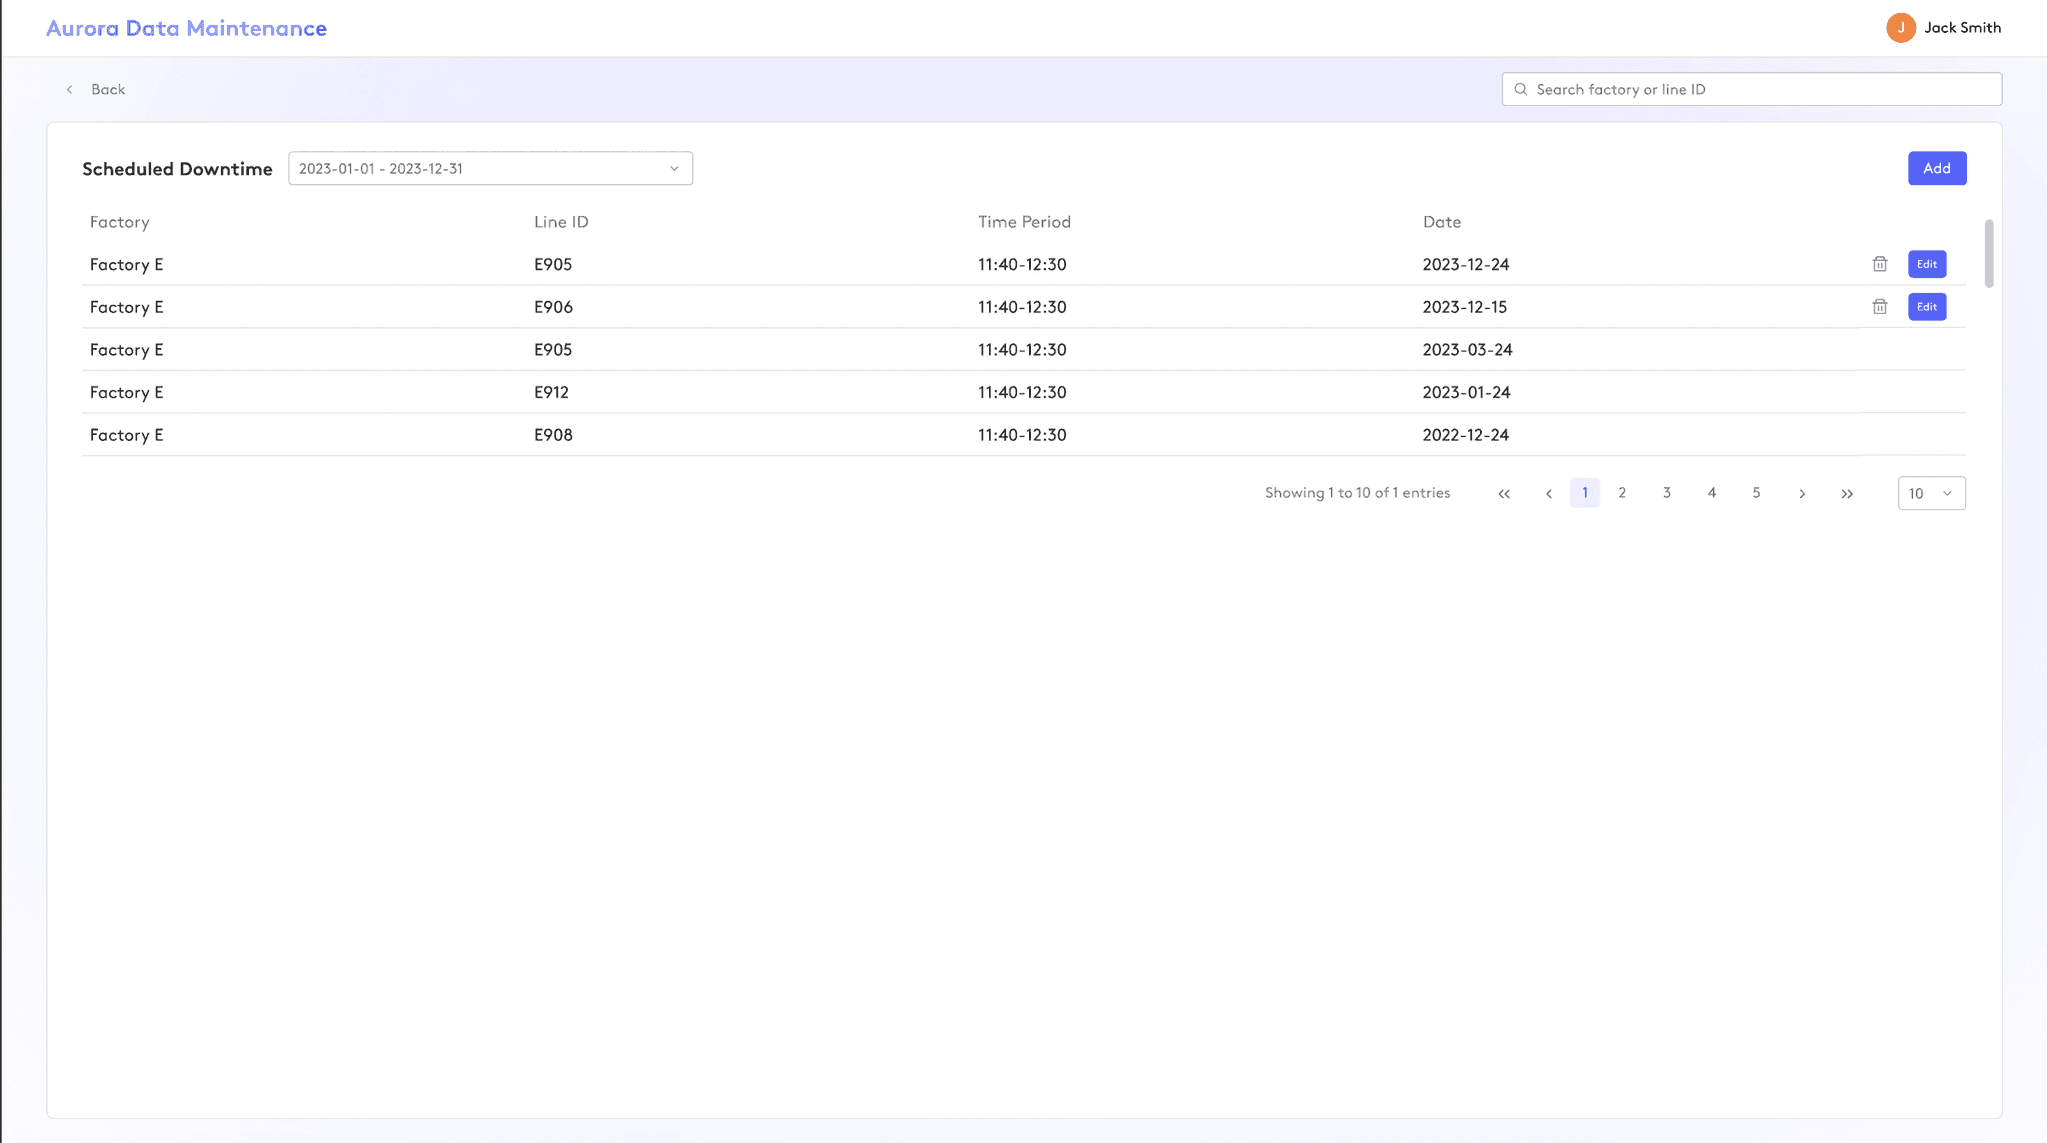

Though machines can work 24/7, they require a scheduled downtime for resetting or closing the session. So, managers would maintain the downtime for data maintenance. The Lofi version only provided daily configuration, which did not fulfill the real-world case that users would like to maintain a long-term fixed downtime or for special events.
Though machines can work 24/7, they require a scheduled downtime for resetting or closing the session. So, managers would maintain the downtime for data maintenance. The Lofi version only provided daily configuration, which did not fulfill the real-world case that users would like to maintain a long-term fixed downtime or for special events.
Enhanced Scheduled Downtime
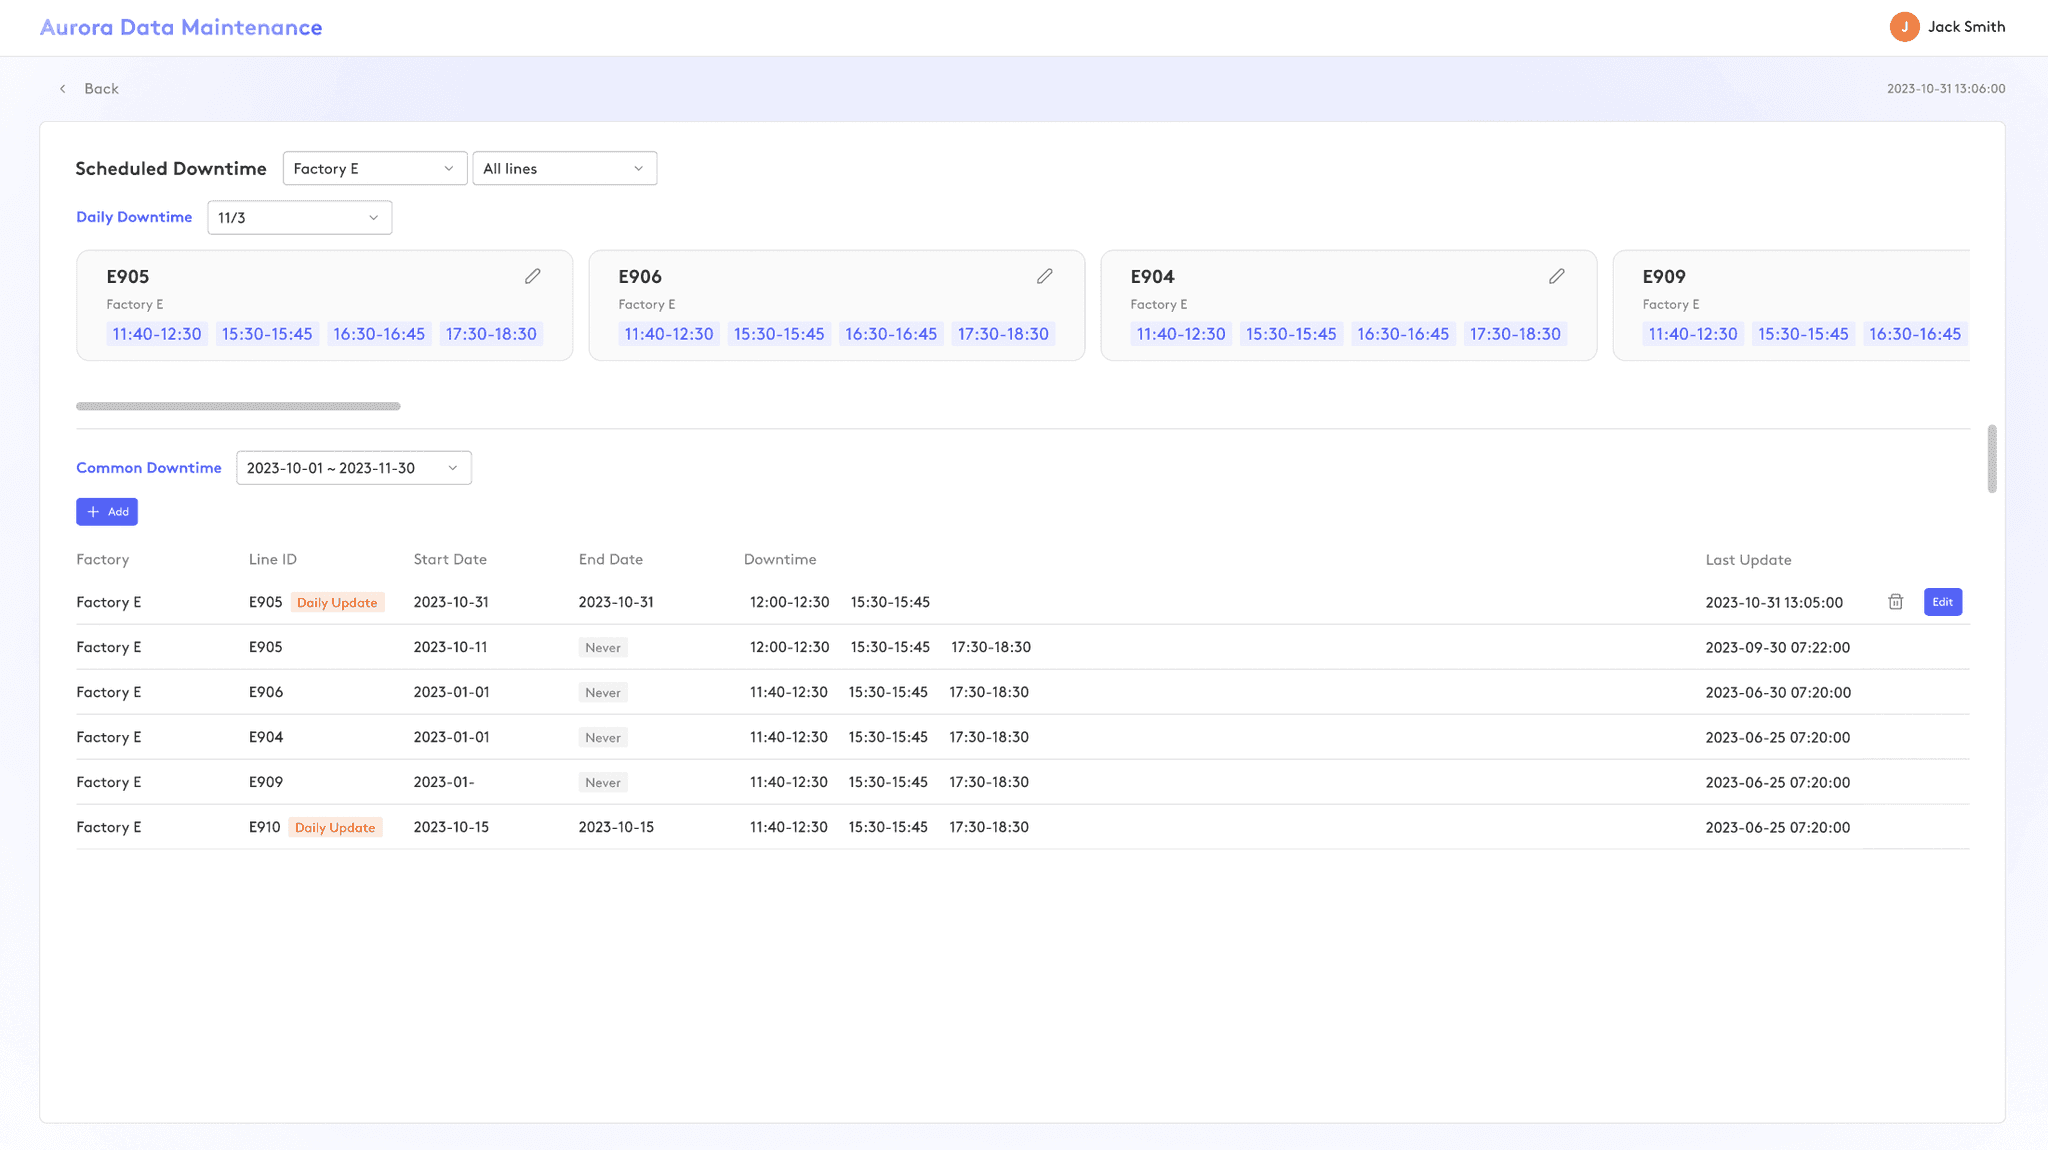

The new version is divided into two parts: the daily downtime for a few-day urgent event and the common downtime for a long-term config. The default is a common downtime without an end date. Managers would add a new daily downtime if there is a 3-hour urgent downtime. However, for a longer one-week holiday, managers would add a new common downtime to separate from the default. This design enables managers to set one-day, short-term, and long-term downtime configurations at a time.
The new version is divided into two parts: the daily downtime for a few-day urgent event and the common downtime for a long-term config. The default is a common downtime without an end date. Managers would add a new daily downtime if there is a 3-hour urgent downtime. However, for a longer one-week holiday, managers would add a new common downtime to separate from the default. This design enables managers to set one-day, short-term, and long-term downtime configurations at a time.
Reflections
Starlight Factory System is my first complete project regarding the manufacturing process. During the session, I gained more profound insights into the production of factories and the employee organization of operating factories. I must present my best appreciation to my supervisor, Howard Sim, who granted me not as a newbie but as a professional UX researcher and project manager. He led us to the factory to investigate the perplexing user needs documents and the converting operations. I learned a lot from evaluating the mindset of factory managers and technicians, and after that, I stand more confident in the design I composed. Beyond that, I also have some reflections on design and collaboration:
Starlight Factory System is my first complete project regarding the manufacturing process. During the session, I gained more profound insights into the production of factories and the employee organization of operating factories. I must present my best appreciation to my supervisor, Howard Sim, who granted me not as a newbie but as a professional UX researcher and project manager. He led us to the factory to investigate the perplexing user needs documents and the converting operations. I learned a lot from evaluating the mindset of factory managers and technicians, and after that, I stand more confident in the design I composed. Beyond that, I also have some reflections on design and collaboration:
Do not wholely rely on users' requirements. When kicking off a project, users would provide materials to guide the development team or to point out their needs. However, we need to address these materials carefully since they might not reflect the real solution for the issue and result in more modification and unsolved problems.
Do not wholely rely on users' requirements. When kicking off a project, users would provide materials to guide the development team or to point out their needs. However, we need to address these materials carefully since they might not reflect the real solution for the issue and result in more modification and unsolved problems.
Proactively explore more tasks. As a designer, I finish design jobs at the very beginning of the project. Fortunately, I proactively reach out to developers to learn how to test processes and evaluate bugs, which will help me become a product manager or developer in my future career and better communicate over technical issues.
Proactively explore more tasks. As a designer, I finish design jobs at the very beginning of the project. Fortunately, I proactively reach out to developers to learn how to test processes and evaluate bugs, which will help me become a product manager or developer in my future career and better communicate over technical issues.